Wednesday, November 29, 2017

PCE, CPI not the same animal

PCE came in today slightly stronger at 1.4% vs 1.3% consensus but remains at pretty low levels.
To understand the difference between CPI and PCE and which measure to use please see the document below
The fed also published an interesting post with some good insights analyzing procyclical and acyclical components of the PCE goods and services deflator
All eyes remain on hourly earnings, health care costs post Obamacare and impact from new tax cuts...growth is back both in developed and EM regions and oil momentum remains strong, all helpful forces for higher inflation into 2018 besides negative impact on housing from higher yields.
That said yields might not rise as much as people think in 2018 despite a 400bn fed retreat. Demand from other players should be healthy with FX reserves building up so expect buying from EM central banks; pensions should also be regular buyers if yields inch higher to keep funding ratios in check around 70/75%, SWF especially middle east should also be buyers as oil grinds higher. Commercial banks after being sellers over the last 5yr should build up their HQLA and finally retail baby boomers should continue to be net buyers (global retail demand for global bonds is reaching 900bn in 2017). 
Risky assets will be supported by healthy growth but we should nonetheless see an increase in volatility, positioning measures are at extremes in most asset classes, equity markets are stretched on many levels, inflation is slowly picking up...treasuries' curve inversion might again be a good timing indicator.

Break-evens December trend should be higher


Monday, September 11, 2017

Bits from the Euromoney Inflation conference

I was at the Euromoney inflation conference last week and it's the first year that people were not bullish inflation. Most of the talks was around how the Philips curve is dead, structural changes (technology, demographics, trade...) and how it is disinflationary (which is true).

My point is more about the change in sentiment from previous years when more than not investors were finding BE cheap as they were heading south, mentioning how much value there is being long etc...the trend for lower BE was usually intact despite a small uptick post conference...

We had a series of low CPI prints recently (mostly driven by wireless prices going down), so I wouldn't be surprised get some surprise on the upside...front end at 1.65 is not a bad entry...

Survey answers about direction of the 5y5y BE were centered between 1.8 to 2.2 (so mildly bullish, more an anchoring bias if you ask my opinion).
One take away might be that CPI inflation swaps are quite expensive at 2.25 (but the instrument is biased less sellers of protection.

Interesting presentation by David Mericle, a GS economist with a view that structural changes in inflation are a little hyped. Most people when they discuss these structural changes are focusing on goods while it is really centered around services.
All the stories will somehow focus on the amazon effect. David showed that Wallmart had more impact than amazon since the mid 90s, amazon lower prices don't always show in the calculations of CPI neither.
Global services are the drivers, health care and Obamacare being one of the main ones...
Overall many component of CPI are still trailing 3% y/y except for smaller portions of the index in serious deflation for 15yrs.

Trade was also an important discussion along with the impact Nafta had since 1995, I am mentioning because obviously a huge trump argument and the many changes that could be impacted with current administration.
   
For the anecdote the organizers were thinking to call the conference the deflation conference next year...interesting switch in sentiment...I am paying attention for upside in BE now that positioning is cleaner. I need to do some research see if the options markets or Risk Reversals are also telling us something and back test the link with BE returns.

Friday, August 4, 2017

US refunding, debt ceiling and their impacts


Now that the treasury has not increased issuance at this August refunding, they will clearly not have enough cash on hand into the debt ceiling so again they will have to draw from their cash reserves at the Fed and increase cash management bills.


In the last episode in March the treasury drew on 400bn of its reserves at he Fed!
In a similar fashion I believe the Treasury reserves at the Fed will drop to 0 into October from 190bn today.

Link between treasury reserves at the Fed and JPY cross currency basis inverted
(Could have picked any ccy basis but JPY tend to be a reserve currency proxy)


This will flood the market with $ liquidity which again will make all cross currency basis correct from negative levels to less negative levels.
This means $ unlikely to strengthen too much despite getting in the cheap zone, other factors like politics, balance of payments, carry will continue to drive valuations unless there is a crisis and flight to quality.


Impact on 10y yield is not fully straightforward but usually treasuries rally as  the Treasury rebuilds its cash balances by buying treasuries they put at the fed in reserves. The opposite is also true, treasuries sell off as the Treasury sells its reserves to meet its cash needs.
Continue to play long CAD-Short US 10y yields into August refunding as a macro RV trade.


I say impact on 10y is bearish at the margin because many other factors affect 10y yields than just the Treasury cash reserve management (Note that the Treasury only has 190bn this time around compared to 500Bn in March).
For example, seasonality and carry are very supportive during the month of August and August tend to be prone to more liquidity crisis due to the holidays creating a flight to quality.

Strong NFP gives an opportunity for small short into next week supply (just few days to set up), but cover post refunding into end of August index extensions which should be greater than 0.1.


Friday, July 28, 2017

US-CAD 10y differential

US-CAD 10y yields differential corrected too much too fast and stands at 26bps
Largest straight decline in 5yrs moving 57bps in the last couple weeks


We see a similar picture in CAD 2y yields differentials and CAD currency


Below is the 3months Libor/OIS spread showing some more stress in the system


The recent move was therefore justified by many macro variables, heating housing market, higher credit risk, a bounce in commodity markets...forcing a change in monetary policy with central bank raising rates
This is confirmed by my global macro model.
Long term model targets a 10y differential at 29bps so pretty close to current 26bps market level, while shorter term model shows a spread at 38bps.
So if short term dynamics are stretched, Z-scores measures are not at less than 1 standard deviation


I still believe move was too fast and worth buying 10y CAD vs 10y US into US supply next month for  trade.


Tuesday, July 18, 2017

Summer trades


Commodity complex active again grains bouncing sugar, cocoa, coffee to name a few (commercial hedgers long and reducing shorts so producers willing to take the risk for higher prices), iron ore, wheat already advanced...should continue to benefit EMG and commodities oriented markets and currencies (AUD breaking multi year trends above 0.77) vs developed (where stock markets are stalling with some hiccups in china, auto loans in US...)...
Trend should be most beneficial to Brazil, MXN, Vietnam, Indonesia, and watching Nigeria carefully before it picks up momentum despite 14% inflation (commos, lower prediction inflation 11%, amazing demographics and heavy investment from china should do it)

In the rates space bouncing off multi year supports across G4, put 2/5 and 2/10 flatteners back on, receivers, swiss/euro short rates at the tight for an RV punt (ESZ8/ERZ8),

Euro above 1.16 might be the only "consensus" trade working


Wednesday, July 12, 2017

Factor investing mania

Returns seem to be inversely proportional to inflows into factor based strategies


Factor investing in the news reached a high last quarter
(Google trends)


Below graphs (courtesy ab insights) show crowed hedge funds factor bets (equities) started underperforming in 2011 and accelerated since 2015
Meanwhile stock picking has done better since late 2015

For other asset classes we see similar trends with CTA inflows the highest in 2016 and poorest performance in the last 15th months


Many reasons are coming out for the underperformance of factor investing and more broadly quant strategies, some you can find in a recent article by Neal Berger https://www.linkedin.com/pulse/turmoil-quant-land-hedge-funds-candid-view-why-strategies-knab
Obviously not all factor investing is done properly and quant strategies mean many things so ask more questions as you allocate.

Now, global macro and discretionary has bad press recently, I wouldn't be surprised to see them outperforming from here as central banks and regulatory environment is taking a back seat, and discretionary traders start using the enormous new open source techniques at their disposal.


Tuesday, July 11, 2017

This can't be too inflationary!

Banks excess liquidity (plentiful) and inverted M2 velocity (weak),

Indicators show Banks are still shy lending and the monetary base multiplier the weakest in years, add to that depressed real disposable income + productivity  and contained inflation makes perfect sense despite massive liquidity infusion by central banks.
The financial assets vs real assets debate still on.
We need a turn around in these measures for bond bears to gain more momentum.
Central banks and regulatory environment finally taking a back seat is slowly starting the process to higher yields, let's watch consequences on banks and employers behaviors.


Wednesday, July 5, 2017

Are we already in a bond bear market?

Chart below shows the logarithmic total return for the 30yr bond, (I built the trendline using traditional touch points but in this case chose ones that match economical events ie lows of 2000 and 2007), chart confirms

- Bond bear market started in 2013 (Taper tantrum),
- Retested the highs (twice) like it often does (30+yr trends/pendulum swings don't reverse at once, it's like a big ship trying to get to a stop and reverse course),
- Never got back above trend
- Making lower highs from here


Now to be fair (always question charts you receive), the outright yield level still tells you the bull market is intact (now outright yield levels only tell half the story, missing coupons and carry) so Total Return is in my opinion a better measure. Now if you look at a line chart of the total return series, the 30+yr bull market is still intact, so which one to believe line chart or logarithmic? I tend to use logarithmic charts to analyze returns across time (geometric returns) and simple line charts (arithmetic returns) for underlying securities or for portfolio aggregation.


Friday, June 30, 2017

China A-share

KBA vs FXI
Into MSCI announcement on June 20, KBA (mainly china A-share) was underperforming FXI (mainly Hong Kong H-share) by 4.5%.

China A-shares tend consistently to have a premium to China H-share (off shore investors asking a discount for the risk) http://www.ftserussell.com/sites/default/files/research/arbitraging_the_chinese_a-shares_and_h-shares_anomaly_final.pdf

Therefore the trade has been buying KBA vs FXI in equal cash amount as the two ETFs have similar volatility.

Finally today the two series converged so for quick arbitrage profit taking is recommended


I will continue to watch KBA closely as it rest on a very important resistance and a break to the upside could bring strong appreciation if it attempts to close the gap (12$, a 38% appreciation!)


An important development has been the appreciation of the Keqiang Index, a proxy for Chinese growth: "Historical Chart change in bank lending, rail freight, and electricity consumption. This ticker takes a weighted average of annual growth rates in outstanding bank loans "

The index is a leading indicator with a greater than a 1y lead. If we trust the relationship then Chinese shares should appreciate over the coming year.

Below you can see that both FXI (orange line) and KBA (Green line) need to catch up.


Happy summer trading.


Monday, June 26, 2017

Curve flattening creates opportunities


Price makes news not the other way around
Now that the press is all over the recent curve flattening, the contrarian in me steps in
It may sound a little Monday morning quarterback but 5/30s flattening made and makes a lot of sense, a combination of...
- weaker US data (see previous post on Soft vs Hard data)
- weaker inflation (see previous post on expensiveness of the 5yr real yield, too high 5y BE and too steep a RY curve)
- weaker volatility and intense grab for yield
- Fed on the move, raising front end rates (maybe for the wrong reason afraid of bubble building more than economical reality)
- Fed discussions on balance sheet unwind (liquidity out of the system, probability of recession goes up, curve flattens)
- Underweight pensions and insurance creating convexity risk and need to receive long end
...and you get the perfect recipe for a flattener from a Momentum and Fundamental macro perspective.

Now Carry is still negative but a lot better than it used to be as roll down is less prohibitive (negative -3.4bps per 3mos in US meaningless compared to recent daily moves)

Value is also starting to turn, if I loved the flattener couple weeks ago, I think the curve is getting ahead of itself.
I don't trade against a major trend but if I have multiple units of risk I am starting to take profit to be able to reload at better levels.

Value measures

5/30s vs Swaps
Treasuries benefited from the announcement that bank regulations might get revised relaxing some of the major hurdles for banks balance sheet (SLR, LCR, NSFR...) so treasuries outperformed swap massively in the long end (10+bps)

5/30s treasury curve (orange) forced flattening in long end forwards and brought risk premiums down further

As you can see below it took long term forwards a couple of weeks/months to react.


5/30s global curves, again treasuries outperforming all


5/30s cash vs Real curves, inflation curve has mean reverted vs Cash treasuries

In March Tips curves was too steep vs Treasuries (see previous post)

 Today Both curves are very flat

5yr treasuries vs Eurodollar curves, 5yr level is cheapish

Technicals

5/30s at multi decade trendline, trend intact from 2010 high


Tactically, 5/30s overdone short term, but reload at the break just above 100


All in all, if the trend is your friend and it might be hard to fight the flattener (from a pure historical basis Flattening has more room to go), I believe you will find better entry points in the next couple weeks as arbitrageurs take advantage of the recent flattening  moves. So take some profit or play some mean reversion before reloading.

Even at depressed volatility measures the rates complex is offering good opportunities, a good omen for hedge fund managers in the rates relative value space.

A mean-reversion Case study showing again that Treasury curve is too flat at the moment

Similarly to the 5/30s curve, 2/10s curve has flattened pretty fast recently.
Here is an example of a mean reverting trade you could put on..
2/10s steepener treasuries vs ED8/12 flattener
The two time series are 95% correlated


I run a mean reversion test and results are ok.
The Hurst exponent is below 0.5 confirming mean reverting properties, the Dickey Fuller test was a little disappointing but still confirming mean reverting properties at the 10% confidence level

Graphically you can also notice the mean reversion in the residuals and the cheapness of the Eurodollar curve vs treasury curve above 2 stdev today


The half life of the mean reversion is 73 days, number I used to back-test the profitability of a basic mean reversion strategy.

The strategy is profitable with 6.17% annualized returns, despite a 22% max drawdown (backtest was not optimized for Drawdowns).
Sharpe is not huge at 0.54 but if you can diversify and add a couple of these in a larger portfolio, the portfolio sharpe should do just fine.

Like any mean-reversion process it is based on the stability of the relationship, every now and then some structural changes disrupt that relationship, in this case it is possible that the treasury curve and the Eurodollar curve stop moving in sync, either because some re-pricing is happening for risk premiums, some regulatory changes are impacting one side more than the other...the only solution is to have defined stop losses methodologies.

Conclusion
Long term the treasury curve should continue to flatten but today the speed of the move suggests to take profit and try some mean reversion strategies in the meanwhile.
Wednesday, April 19, 2017

Investing mistakes in a few graphs

Forecasting business is hard
Don't always trust the experts, stay nimble and open minded or stick to a robust back-tested process
GDP and monetary policy forecasters get it wrong more than not

Investing is a long term game, stay invested and...

Miss the 10 best days and returns falter

...diversified
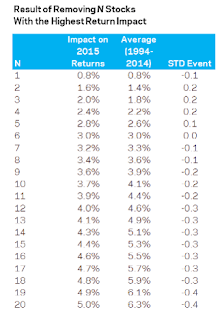
Miss the 10 best stocks and your returns suffer an average of 4%
Source AQR

The average investor is poor at timing markets


Green line shows index weighted by investors inflows/outflows, clearly average investors tactical moves hurt them
Risk Management matters

Watch your drawdowns (DD) and ask for Returns/MaxDD stats when you invest with a fund.
Have a clear risk management system, it is really hard to come back from a nasty drawdown


Friday, April 7, 2017

CZK...and the Peg goes

CNB finally let the EURCZK peg go allowing the currency to float below the 27 EURCZK floor.

The CNB had started intervening in FX markets on November 2013 to weaken the CZK to avoid a liquidity trap and a deflationary environment.
By 2017 the CNB Euro reserves had increased by 50bn.

Late 2016, as the inflation target (2%) was reached, the CNB announced it would end the peg sometime past Q1 2017.
Sticking to its promise the CZK is now floating again.

The appreciation after the first day of trading post peg has been orderly with a 1.7% gain, the most of EM currencies but in contrast to the Swiss experience when the Franc surged 29% intraday vs the Euro in January 2015 when the SNB surprised the markets.

Something to be said about transparency and preparing markets!
It is estimated that speculators have accumulated more than 60Bn in bets against the currency pair (short EUR vs CZK). This means the road to fair value will be bumpy.

The CNB also reserves the right to intervene when necessary : "The CNB stands ready to use its instruments to mitigate potential excessive exchange rate fluctuations if needed".

Now let's try to understand what is fair value and where the floating currency should settle at over the medium term?

  • BoA Compass model estimates fair value closer to 24
  • PPP (Purchasing power parity my least favorite indicator) implies EURCZK anywhere between 19 and 25!
  • REER (Real effective exchange rate) model shows EURCZK undervalued (Z-score -1)
  • CZK vs a correlated eastern block basket also suggest sub 24 fair value (ok not as robust as z-scoring index but graph good enough for our purpose)
  • Finally a model using macro differential variables suggests a EURCZK between 24.9/25.25

The model is built on estimating long term weights from Q1 2000 to December 2013  (up to the peg)  and estimating EURCZK up to Q1 2017.

Pre Peg, EURCZK was trading around 25.5, below is EURCZK (orange) and BIS NEER model (white)


All in all over the medium term the EURCZK could appreciate another 5% to 25.25.
Again keep in mind that volatility will pick up and positioning is already massively long the local currency. That said the downside is probably also limited if the economic recovery remains strong. The CNB could also intervene the other way around, unloading its Euros if CZK depreciates too much (towards 28).

Rate hikes priced in are barely 30bps for 2018, so some room to price in closer to 75bps if the pace of the economy continues
Carry (Long CZK/Short EUR) is positive about 2bps a quarter for now.
ADV (Average Daily Volumes) are about 7bn USD equivalent, ranking 28th currency in terms of turnover according to the BIS (less liquid than most).


Wednesday, March 29, 2017

Soft vs Hard data - Mind the Gap

The gap between survey based indicators (Consumer confidence, small business optimism...) and hard data indicators (Investments, Retail sales, Loans...) is at the widest levels we've seen in a while, indicating some emotional overreaction to future "Trump policies".

Couple of banks: Credit Suisse, Nordea, Morgan Stanley have recently voiced their concern along with Atlanta Fed economists


The Atlanta Fed and the NY Fed's GDP forecasts for Q1 2017 have also diverged significantly (respectively 1% vs 3%).
The Fed of Atlanta focus is on hard data while the Fed of NY model incorporates soft data.


I rebuilt two quick time series as well, for hard data I used the Atlanta Fed GDPnow as a proxy and for the softdata I used an average of the yearly changes for : Consumer confidence, Small businesses optimism and ISM.
The right graph shows a mean reverting time series, testing close to 0 for Hurst exponent* and Dickey-Fuller test *.
As observed, when the spread is above 8 the series tend to mean revert pretty fast, within 2 to 3 months.
So expect surprise indices and soft indicators to print lower in the next quarter.

Finally, for the anecdote, a friend of mine highlighted that most of the enthusiasm is coming from...Republican voters!


* Note that sample is small