Sunday, April 26, 2020

Monday, April 6, 2020
Fed
impacts, context and inflationary pressures
The Fed’s response to the current health crisis is
unprecedented in scale. In two weeks, the Fed has slashed interest rates to zero,
implemented a shock and awe Quantitative Easing program, buying one trillion
bonds (the previous largest QE2 program 800bn…had taken
2years to achieve!), the Fed also launched many programs to boost market liquidity and help fund large and small companies.
Below I highlight some of these programs to show the massive
scale:
- Unlimited QE: Treasuries, MBS and CMBS
- Primary and Secondary Credit facilities
- TALF, for ABS (Asset Backed Securities)
- TALF II, for Auto, Student…loans
- TALF III, for riskier ABS
- MMLF, to back up Muni debt as States deficits are ballooning and risk bankruptcies
- A Commercial Paper (CP) program for banks to finance themselves short term
- A Primary Dealers financing window
- Central banks $ swap lines to make dollar liquidity available to foreign entities
- A Central banks repo facility to avoid a fire sale of treasuries by foreign entities, after the latter sold 100bn in a week
- A lending facility for small businesses thru the Paycheck Protection Program…
The Fed is also doing everything in its powers to facilitate
the transmission mechanism of its various programs. In the past it had relied
solely on banks for that, but it seems that it is learning from its mistakes. Following
the 2008 crisis, despite large amounts of liquidity injected in the system,
banks remained reluctant to lend. At the time, it was a financial crisis and
new regulations forced bank to deleverage, watch their capital ratio and
weighted assets. So instead of lending, they kept on hand billions of dollars that
they conveniently placed at the Fed’s IOER window (Interest on excess reserves)
for a small carry arb. That phenomenon killed the velocity of money and
contributed to tepid growth.
Recent measures from the Fed to lower the burden on banks,
relaxing their SLR (Supplemental Leverage Ratios) are powerful measures and will
probably help inject another 1.6tr of liquidity in the system, allowing more
leverage thru repo books, facilitate Prime Brokers channels…
These types of measures are surely different than the ones implemented
in 2008 that penalized intensive balance sheet businesses (Gross notionals and
risk insensitive). The new measures will
probably contribute to higher velocity of money this time around. Higher
velocity of money was the missing ingredient for higher inflation.
All in all, the fed
has already injected 2 trillion dollars of liquidity, the government will also
inject 2 trillion thru its fiscal response, while banks are in a position to
release an extra 1.6 trillion of liquidity, totaling 6 trillion or 25% of the
US GDP!
You probably understand where I am heading with my comparisons.
It seems to me that if very short term the crisis
is deflationary, prices across the globe are tumbling: oil, copper, Hotel
rooms, food away from home…
Medium term, I wouldn’t be surprised to see inflation
pressure building up fast:
- Much of the stimulus is going straight to companies and employees which will reinject directly in the economy, classic Keynesian behavior
- Most countries are learning their lessons of ultra-reliance on cheap goods from China. I believe many developed countries will rebuild their own manufacturing businesses, at least in the health care and primary needs sectors
- Globalization was already being questioned pre-virus, the break up of supply chains will just accentuate from here
- At the zero bound, fiscal policies become even more relevant taking over monetary , we are moving from the liquidity trap to the liquidity boon
- Corporate issuance has already exploded (some days more than 30bn, with mega deals like the 19bn T-Mobile offering), I am hopeful that this time around that money will not go to buybacks but back to support investments in capex and employees…unless of course they pay down debt with new debt
- Velocity of money tend to be correlated to the level of rates and at current levels no room to go lower (the Fed contrary to European Central Banks, is reluctant to allow negative yields) so that should put a floor to the velocity of money from here
- All central banks and governments are following the Fed initiatives so inflation pressures will be a global phenomenon
- Crisis of this nature tend to have a V shape recovery
- Lower commodity prices are already priced in with many commodities in contango and many trading below their production costs (See graphs below),
- Similarly, inflation expectations have priced outright depression two weeks ago as fears and deleveraging hit markets hard. Back then, I sent a note showing 5 year Break-Evens were pricing -8bps, so an average deflation for 5 years! Even in 2008 the realized inflation floored at 100bps. Since, Break-evens and Real Yields have rallied 50 to 75bps as the markets are digesting the massive stimulus put in place to fight the negative impacts of the pandemic.
All in all, the massive scale and speed of the stimulus put
in place by the monetary and fiscal authorities should this time be more
inflationary than not. The Fed paying special attention to the transmission
mechanisms is a major difference compared to the 2008 policies. Trade supply
chain disruptions and a manufacturing boost in developed countries should also
be inflationary. I am not saying we are going back to the 1950s, services will
remain a larger part of GDP growth with all the deflationary pressures from technology advancements and all, but at the margin the inflationary forces
should be higher than they were over the last 25yrs of globalization. New trends towards European models of the welfare state when it comes to health care and the treatment of employees could also add to inflationary pressures.
Now, lower interest rates are probably here to stay which could
hurt the velocity of money, but even that is questionable as the world is entering
a new MMT (Modern Monetary Theory) experiment with unlimited supply of
government bonds and deficits.
The risk remains that we are just fueling yet another bubble
(lessons in greed and fear are hardly learnt), applying the same medicine to
any problem we face, as an MIT professor said: "This crisis has taught us one thing, that if the Martians
attack Earth, our first response would be to lower interest rates."
Appendix:
If the Velocity of money has headed one way, down…

…I prefer to watch a different indicator : [Velocity * M2 yoy
growth] which started grinding higher since 2019, M2 is clearly on the rise
after this month Fed’s shock and awe and I expect Velocity to pick up as well
as the Fed pays special attention to the transmission mechanisms

Oil, Copper and Bloomberg Commodity index are already very
depressed

Source
Bloomberg
Buybacks, the shareholders decade

Source Larry
McDonald
Trad’em well
Hicham Hajhamou
Wednesday, May 8, 2019
The unintended consequences of protectionism
As trade disputes between the Trump administration and China intensify, I thought would be useful to review some of the experiences with protectionism
Click on link
Trade and Protectionism
Click on link
Trade and Protectionism
Tuesday, September 25, 2018
Rates dynamics...they are changin
September brings new dynamics to the rates complex, it should make idiosyncratic rates trading more interesting from here.
Auction strategies, relative value should pick up as collateral plays are more dynamic.
- The Pension bid we have experienced in the long end of treasuries for all of 2018 is gone, pensions had till September 15th to front load their pension expenses at the 35% tax rate deduction. The new 21% corporate tax rate is now in effect.
Stripping activity was the best indicator to follow that flow, it finally reversed in August.

(source Macrobond)
- Deficits and Monthly treasury supply is intimidating, we just passed the 1 trillion (yes with a T) Monthly supply mark during the August refunding month, a staggering number!
 (Source Sifma)
- SOMA : The Fed has implemented Caps (24bn for September, raises to 30bn for October 2018); that means the Fed will not participate in the upcoming auctions to reinvest the coupons it receives from its blotted portfolio unless the coupons are above a certain treshold (30bn), part of taper.
Expect less back bid for treasuries at the auctions and potentially more tails or at least more premium plays into and out of the auctions.

- Tic Data, less buying of treasuries from Foreigners, not a new phenomenon but net foreign is still negative, trade wars will not help.

(Source Treasury)
Overall, I expect Treasuries' auction strategies to start working again, duration plays (day of the auction), curve, flies and swap spreads T-5/T+5 from the auction...
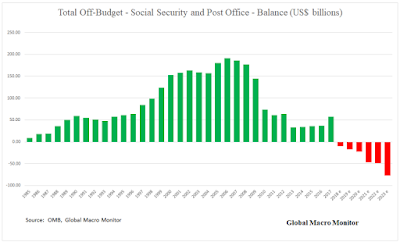
- Social security in the red from here, with inability to tap the social security trust fund
 (Source Global Macro Monitor)
- Quantitative Tightening and "Reserves fracking"
US surprise indices and data was very healthy in Q3.
Inflation and wages are on the rise accross geographies.
Global Quantitative Tightening on the way. In the US, market is pricing 3% Fed Fund rate by Sep 2019.
More importantly, money markets are feeling the switch from Reserves excess to Collateral excess. Experiencing a world where most participants manage their cash deposits at the Fed vs the banking system, what Zoltan Pozsar calls the "Shadow funding black holes". The Fed is not recycling that cash so it means lower lending, lower turnover, lower velocity and scarcity of dollars.
Quarter end turns are more severe and require JP Morgan to step in to facilitates. It comes at steep prices (LCR and SLR constraints binding them and requiring premium rates to compensate for ratio deterioration).
Overall it means higher financing rates for the system and more expensive cross currency basis.
The trifecta, Rising rates, Sterilization of reserves thru FX swaps and Reserves squeeze thru Balance sheet taper is putting enormous pressure, pushing o/n rates higher and flattening curves.
Banks went from repo lenders to repo borrowers, an expensive way of getting cash back, adding to the collateral excess in the system.
- Carry makes flatteners expensive from here

- Inflation
Inflation is picking up, wages, commodities...and Tips markets are noticing with inflation indices breaking significant technical levels
20y tips index


Overall, massive deficits and more dependencies on domestic players to fund it, requires higher risk and term premiums.
Rates markets should become more interesting for macro players after years of no volatility.

The next crisis should also come not from banks this time but leveraged weak Corporates. These players don't have access to the Fed to fund themselves. Banks and markets will price things accordingly when the time comes especially in this Reservesless world!
Auction strategies, relative value should pick up as collateral plays are more dynamic.
- The Pension bid we have experienced in the long end of treasuries for all of 2018 is gone, pensions had till September 15th to front load their pension expenses at the 35% tax rate deduction. The new 21% corporate tax rate is now in effect.
Stripping activity was the best indicator to follow that flow, it finally reversed in August.

(source Macrobond)
- Deficits and Monthly treasury supply is intimidating, we just passed the 1 trillion (yes with a T) Monthly supply mark during the August refunding month, a staggering number!

- SOMA : The Fed has implemented Caps (24bn for September, raises to 30bn for October 2018); that means the Fed will not participate in the upcoming auctions to reinvest the coupons it receives from its blotted portfolio unless the coupons are above a certain treshold (30bn), part of taper.
Expect less back bid for treasuries at the auctions and potentially more tails or at least more premium plays into and out of the auctions.

- Tic Data, less buying of treasuries from Foreigners, not a new phenomenon but net foreign is still negative, trade wars will not help.

(Source Treasury)
Overall, I expect Treasuries' auction strategies to start working again, duration plays (day of the auction), curve, flies and swap spreads T-5/T+5 from the auction...
- Social security in the red from here, with inability to tap the social security trust fund

- Quantitative Tightening and "Reserves fracking"
US surprise indices and data was very healthy in Q3.
Inflation and wages are on the rise accross geographies.
More importantly, money markets are feeling the switch from Reserves excess to Collateral excess. Experiencing a world where most participants manage their cash deposits at the Fed vs the banking system, what Zoltan Pozsar calls the "Shadow funding black holes". The Fed is not recycling that cash so it means lower lending, lower turnover, lower velocity and scarcity of dollars.
Quarter end turns are more severe and require JP Morgan to step in to facilitates. It comes at steep prices (LCR and SLR constraints binding them and requiring premium rates to compensate for ratio deterioration).
Overall it means higher financing rates for the system and more expensive cross currency basis.
The trifecta, Rising rates, Sterilization of reserves thru FX swaps and Reserves squeeze thru Balance sheet taper is putting enormous pressure, pushing o/n rates higher and flattening curves.
Banks went from repo lenders to repo borrowers, an expensive way of getting cash back, adding to the collateral excess in the system.
- Carry makes flatteners expensive from here

- Inflation
Inflation is picking up, wages, commodities...and Tips markets are noticing with inflation indices breaking significant technical levels
20y tips index


(Source Nordea)
Overall, massive deficits and more dependencies on domestic players to fund it, requires higher risk and term premiums.
Rates markets should become more interesting for macro players after years of no volatility.

The next crisis should also come not from banks this time but leveraged weak Corporates. These players don't have access to the Fed to fund themselves. Banks and markets will price things accordingly when the time comes especially in this Reservesless world!
Tuesday, July 10, 2018

Monday, June 25, 2018
10yr cycles...88, 98, 2008...should we expect a volatile summer?

Summer 2018
If the economy is still strong in the US, globally some cracks are appearing, dollar strenghtening has weakened Emerging markets, China is facing trade tariffs from the Trump Administration, in response they are lowering their leverage standard releasing 100bn of liquidity in the system, Canada and LATAM are also hurt by Nafta rethoric and internal issues (Brazil, Argentina), geopolitical risks are also on the rise with a mid term election coming fast...
Time to step back, put some cash aside and understand what might give
Liquidity is drying up fast...quantitative tightening, stronger dollar and global central banks QE programs ending
Excess liquidity (Real M1 yoy - GDP yoy) turning negative for the first time
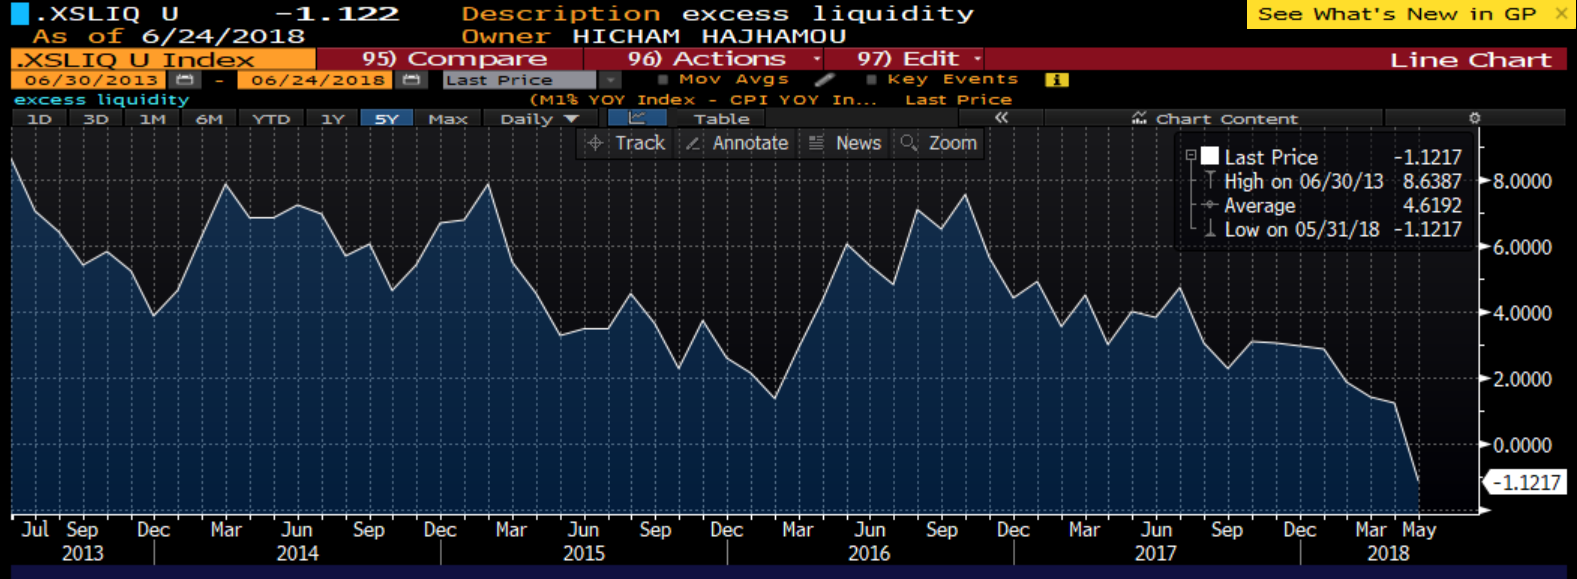
Nordea clearly shows excess liquidity correlation to dollar

Curves as predictor of recessions,
Well curves are already inverted depending which one you follow
JPM uses its own weighting for global sovereign curves (overweighting US)

Credit is also fairly stretched

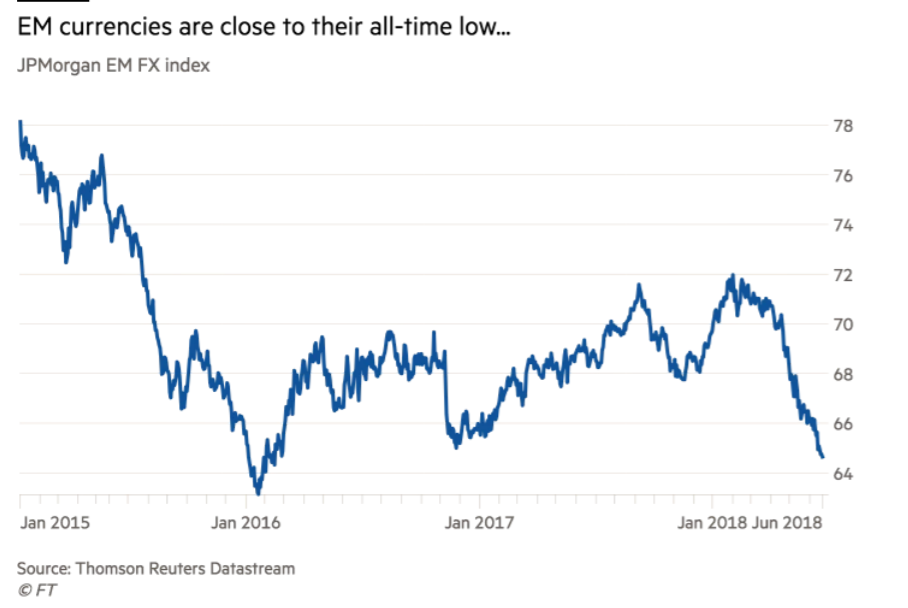
EM bonds and FX suffering despite some good performance for some commodities
No wonder china is releasing more iquidity in the system




Portoflio concentration is at an all time high

Bonds are a better investment than dividend paying stocks

Stock yields vs bond yields again showing equities stretched

Smart money is better at reading tea leaves and better sellers than buyers SPX

Finally, bitcoin is down 70% but surprisingly its volatility is also down quite a bit, believers are still not washed out?

Happy summer, trad'em well
Front end dynamics matter more than you think
The first half of 2018 has seen an oversupply of front end paper. Bills issuance will reach 400bn this year, Bills are now the effective
floor for rates markets.
We are also seeing an oversupply of FHLB loans which lately are the largest provider of collateral for banks HQLA
(High Quality Liquid Assets).
Foreign central banks are using the Fed foreign repo pool on
a larger scale as US commercial banks are pushing away non-operating deposits from CB and
corporates (Due to ratios and balance sheet constraints).
The Fed helped uncapping
foreign repo pools. The Fed also returns cash by 830 am vs 330pm for tri-party
repo. Foreign repo grew to about 250bn.
Repo rate are now printing above IOR (Interest on Reserves at the Fed) and fed funds are following through.
The demand side of the equation is also disrupted as CFOs react to repatriation and
BEAT policies, they also have access to more agency floater reducing the need for Bills at a time when the treasury is floading the market.
More sophisticated investor have been playing the cross
currency arb, investing in foreign money market.
Higher Libor, triparty repo rate is costly for the inter
dealer market and the Relative Value community.
Now that repo is above funds rate, FHLB are lending in repo
market and less in the fed fund market, weakening the latter.
The traditional arb [o/n fed fund – IOR] from foreign banks is not en vogue anymore, it’s more
about settlement risk and balance sheet constraints, LCR (Liquidity cover
ratio) nowadays.
Japanese MOF through Japanese banks in the US has also floaded
the market with collateral.
Dealers took the Treasuries they borrowed from the MoF and
pledged it in the o/n repo market in New York and then took the cash and lent
it in the FX swap market to meet the hedging needs of life insurers and
regional banks.
Ninja Bills and synthetic bills are the new rage.
$1 trillion in synthetic Treasury bills are issued every
three months in Tokyo alone – about $400 billion more than just three years ago
according to Credit Suisse.
Exposure to Japanese lifers is mounting (Some regulators are
getting uncomfortable).
Policymakers in Japan and Europe have been proactively
trying to reduce the reinvestment drag for non-bank lenders of dollars in FX
swaps. The less the drag, the better the spread of synthetic bills over
Treasury bills, the more dollars are being lent via matched FX swap books and
the less the pressure on cross-currency bases to Libor.
As Pozsar would frame it: “We are swimming in safe assets
and by adding to the supply by issuing more bills, we are making it more
expensive for the rest of the world to buy dollar assets on a hedged basis. As
a borrower nation, we need the foreign marginal buyer and we should not make
their hedging costs higher than necessary by issuing more bills.”
No wonder rates have had no difficulty going higher, FED
wind in your sail, carry in your favor, double whammy for treasuries.
In previous post you can see that treasuries at 3% are not
as attractive to foreigners once you hedge the FX component.
Understanding front end dynamics is more often than not a key factor to fixed income returns.
Now if summer 2018
brings more volatility, a flight to quality might bring buyers anticipating
capital gains.
Thursday, April 26, 2018

Wednesday, November 29, 2017
PCE, CPI not the same animal
PCE came in today slightly stronger at 1.4% vs 1.3% consensus but remains at pretty low levels.
To understand the difference between CPI and PCE and which measure to use please see the document below
The fed also published an interesting post with some good insights analyzing procyclical and acyclical components of the PCE goods and services deflator
All eyes remain on hourly earnings, health care costs post Obamacare and impact from new tax cuts...growth is back both in developed and EM regions and oil momentum remains strong, all helpful forces for higher inflation into 2018 besides negative impact on housing from higher yields.
That said yields might not rise as much as people think in 2018 despite a 400bn fed retreat. Demand from other players should be healthy with FX reserves building up so expect buying from EM central banks; pensions should also be regular buyers if yields inch higher to keep funding ratios in check around 70/75%, SWF especially middle east should also be buyers as oil grinds higher. Commercial banks after being sellers over the last 5yr should build up their HQLA and finally retail baby boomers should continue to be net buyers (global retail demand for global bonds is reaching 900bn in 2017).
Risky assets will be supported by healthy growth but we should nonetheless see an increase in volatility, positioning measures are at extremes in most asset classes, equity markets are stretched on many levels, inflation is slowly picking up...treasuries' curve inversion might again be a good timing indicator.
Break-evens December trend should be higher
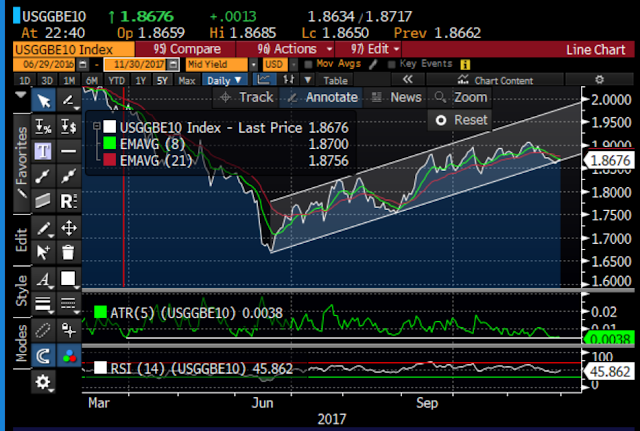
Break-evens December trend should be higher

Differences CPI, PCE by Hicham Hajhamou on Scribd
Monday, September 11, 2017
Bits from the Euromoney Inflation conference
I was at the Euromoney inflation conference last week and it's the first year that people were not bullish inflation. Most of the talks was around how the Philips curve is dead, structural changes (technology, demographics, trade...) and how it is disinflationary (which is true).
My point is more about the change in sentiment from previous years when more than not investors were finding BE cheap as they were heading south, mentioning how much value there is being long etc...the trend for lower BE was usually intact despite a small uptick post conference...
We had a series of low CPI prints recently (mostly driven by wireless prices going down), so I wouldn't be surprised get some surprise on the upside...front end at 1.65 is not a bad entry...
Survey answers about direction of the 5y5y BE were centered between 1.8 to 2.2 (so mildly bullish, more an anchoring bias if you ask my opinion).
One take away might be that CPI inflation swaps are quite expensive at 2.25 (but the instrument is biased less sellers of protection.
Interesting presentation by David Mericle, a GS economist with a view that structural changes in inflation are a little hyped. Most people when they discuss these structural changes are focusing on goods while it is really centered around services.
All the stories will somehow focus on the amazon effect. David showed that Wallmart had more impact than amazon since the mid 90s, amazon lower prices don't always show in the calculations of CPI neither.
Global services are the drivers, health care and Obamacare being one of the main ones...
Overall many component of CPI are still trailing 3% y/y except for smaller portions of the index in serious deflation for 15yrs.
Trade was also an important discussion along with the impact Nafta had since 1995, I am mentioning because obviously a huge trump argument and the many changes that could be impacted with current administration.
For the anecdote the organizers were thinking to call the conference the deflation conference next year...interesting switch in sentiment...I am paying attention for upside in BE now that positioning is cleaner. I need to do some research see if the options markets or Risk Reversals are also telling us something and back test the link with BE returns.
My point is more about the change in sentiment from previous years when more than not investors were finding BE cheap as they were heading south, mentioning how much value there is being long etc...the trend for lower BE was usually intact despite a small uptick post conference...
We had a series of low CPI prints recently (mostly driven by wireless prices going down), so I wouldn't be surprised get some surprise on the upside...front end at 1.65 is not a bad entry...
Survey answers about direction of the 5y5y BE were centered between 1.8 to 2.2 (so mildly bullish, more an anchoring bias if you ask my opinion).
One take away might be that CPI inflation swaps are quite expensive at 2.25 (but the instrument is biased less sellers of protection.
Interesting presentation by David Mericle, a GS economist with a view that structural changes in inflation are a little hyped. Most people when they discuss these structural changes are focusing on goods while it is really centered around services.
All the stories will somehow focus on the amazon effect. David showed that Wallmart had more impact than amazon since the mid 90s, amazon lower prices don't always show in the calculations of CPI neither.
Global services are the drivers, health care and Obamacare being one of the main ones...
Overall many component of CPI are still trailing 3% y/y except for smaller portions of the index in serious deflation for 15yrs.
Trade was also an important discussion along with the impact Nafta had since 1995, I am mentioning because obviously a huge trump argument and the many changes that could be impacted with current administration.
For the anecdote the organizers were thinking to call the conference the deflation conference next year...interesting switch in sentiment...I am paying attention for upside in BE now that positioning is cleaner. I need to do some research see if the options markets or Risk Reversals are also telling us something and back test the link with BE returns.
Subscribe to:
Posts (Atom)